DBUs Explained: What They Are, How They Cost, How to Optimize
A DBU is the metering unit Databricks uses to bill compute, with rates that differ by compute type. How to tune DBU spend without risking workloads.
If you’ve ever looked at a Databricks bill and thought “okay… but what is a DBU, and why is my bill the way it is?”, you’re not alone. DBUs are the unit behind most of Databricks’ pricing, but they’re abstract enough that it’s hard to connect them to specific workloads.
This post is a practical walkthrough: what a DBU is, how DBU cost gets calculated, what drives consumption across common workload patterns, how to troubleshoot a spend change when it happens, and a few optimization moves that don’t put your environment at risk.
What Is a DBU?
A DBU is the unit Databricks uses to meter compute consumption, normalized so pricing stays consistent across different workload types and configurations. It’s closer to “how much of this Databricks compute category did you consume” than to “CPU hours” or “compute time.”
Two practical implications:
- DBUs tell you “how much” of a category you used, not “why.” You still need workload context to explain the driver behind a number.
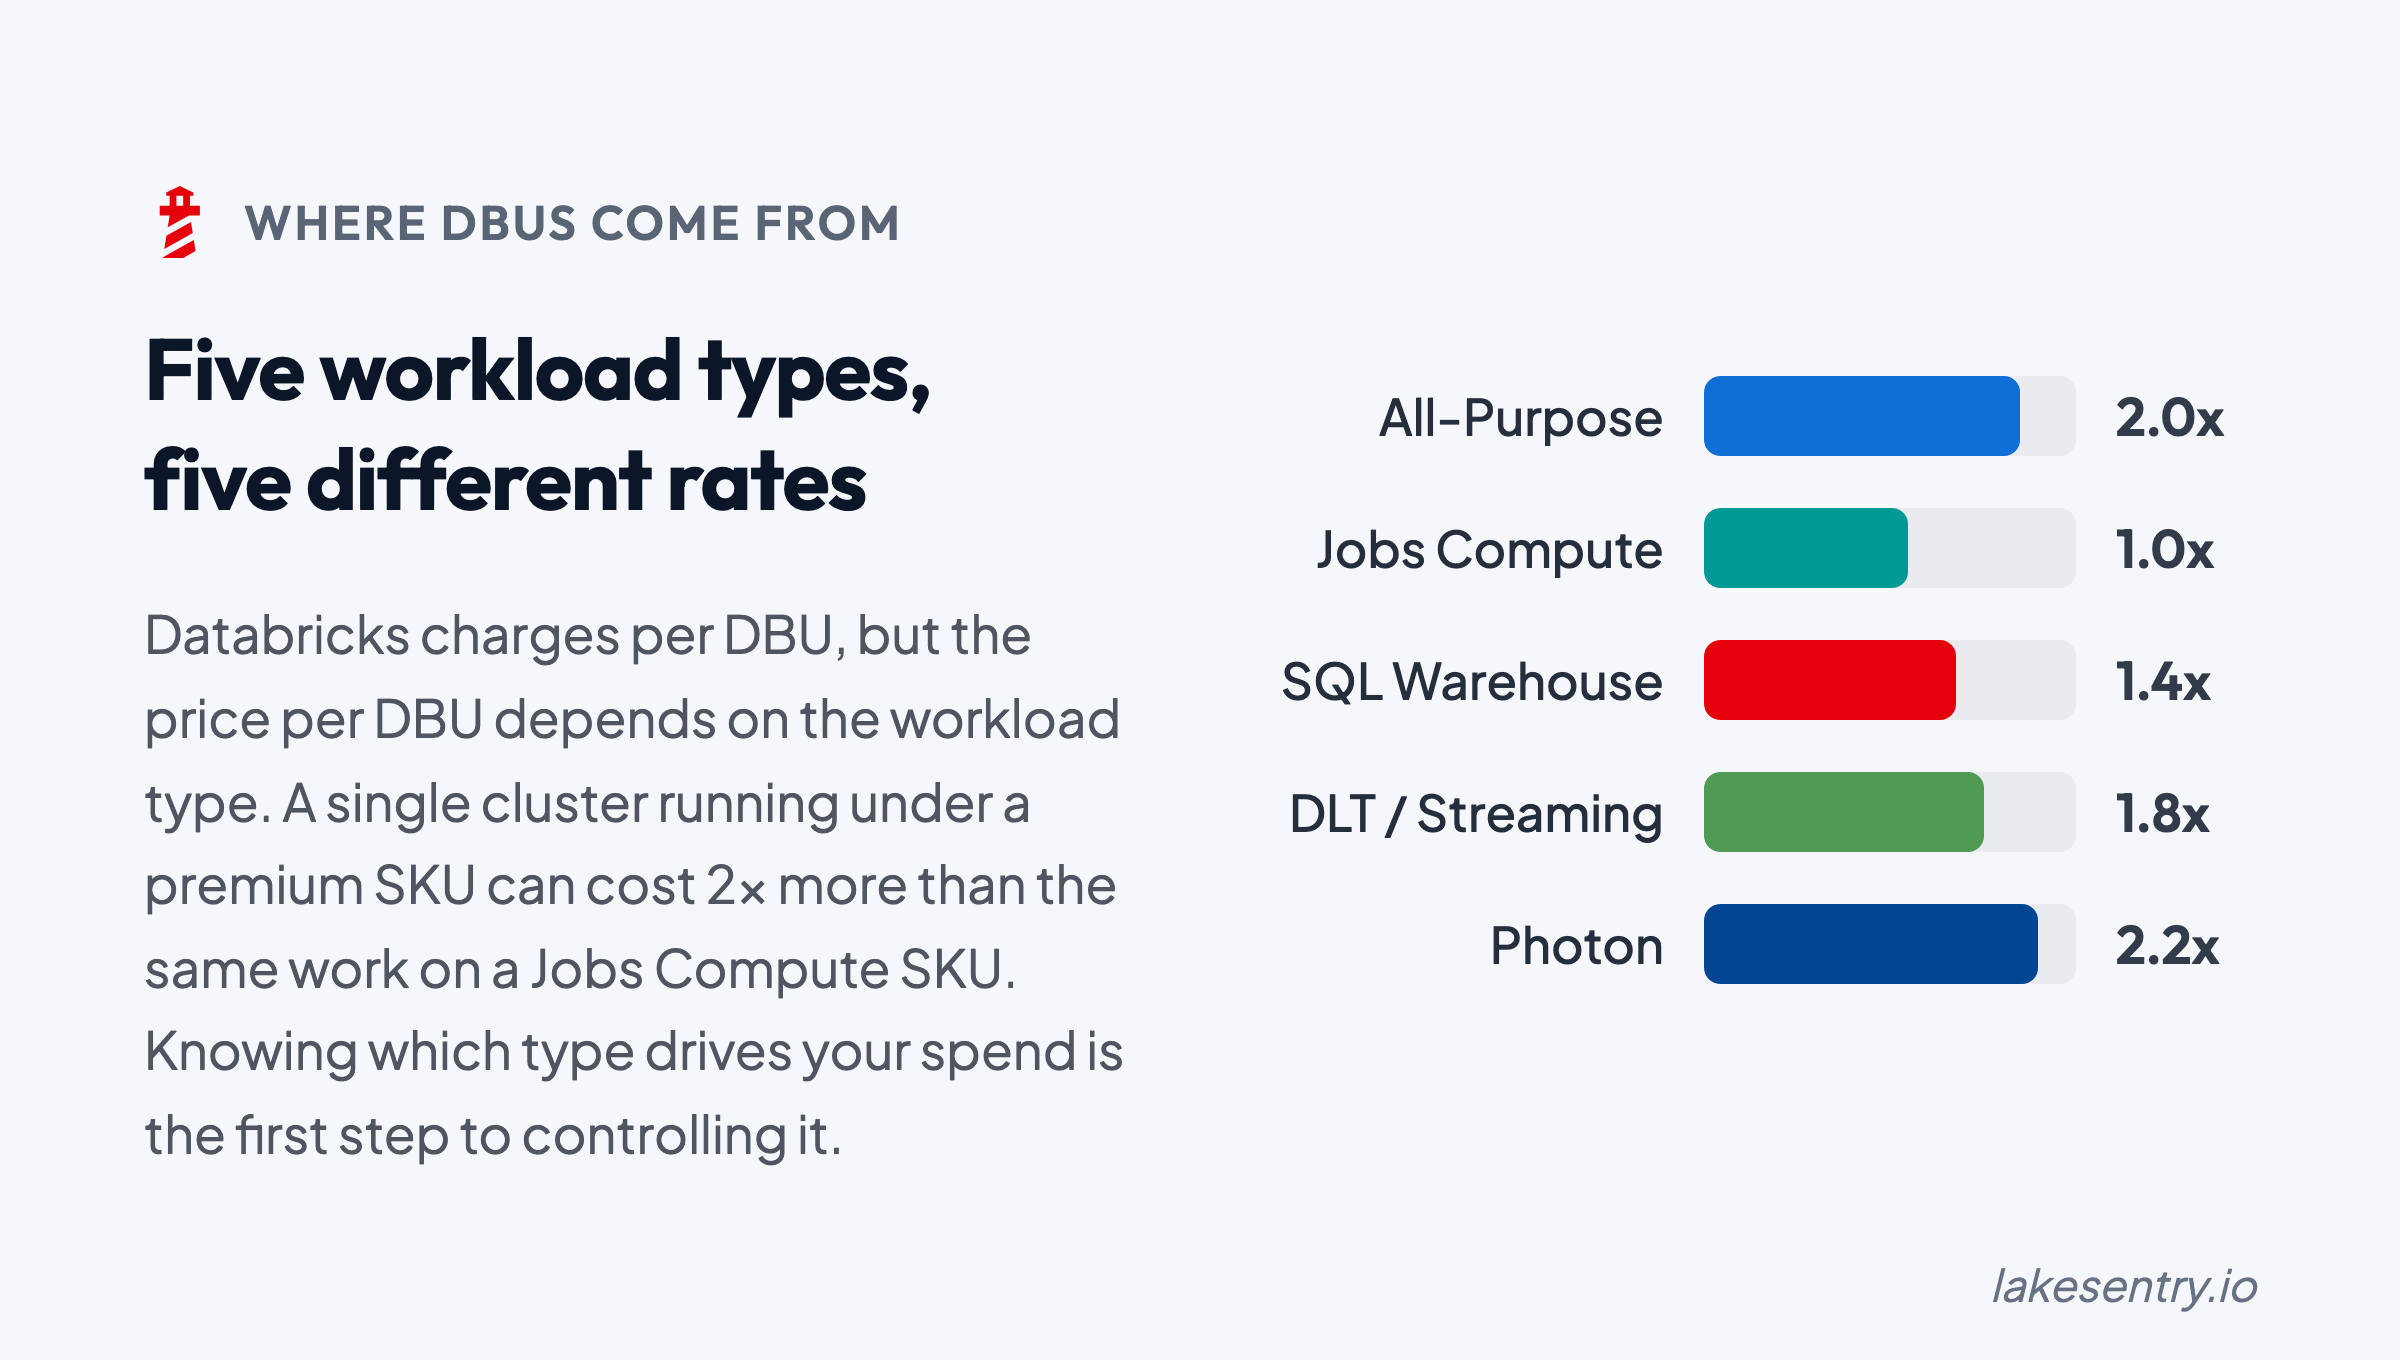
- DBU rates can differ by compute type and plan. Jobs/batch, SQL warehouses, all-purpose clusters, and serverless can be priced differently depending on your Databricks setup and your cloud provider terms.
DBUs are the cost units, but you still need a method to map them back to the work that produced them.
How DBU Cost Is Calculated
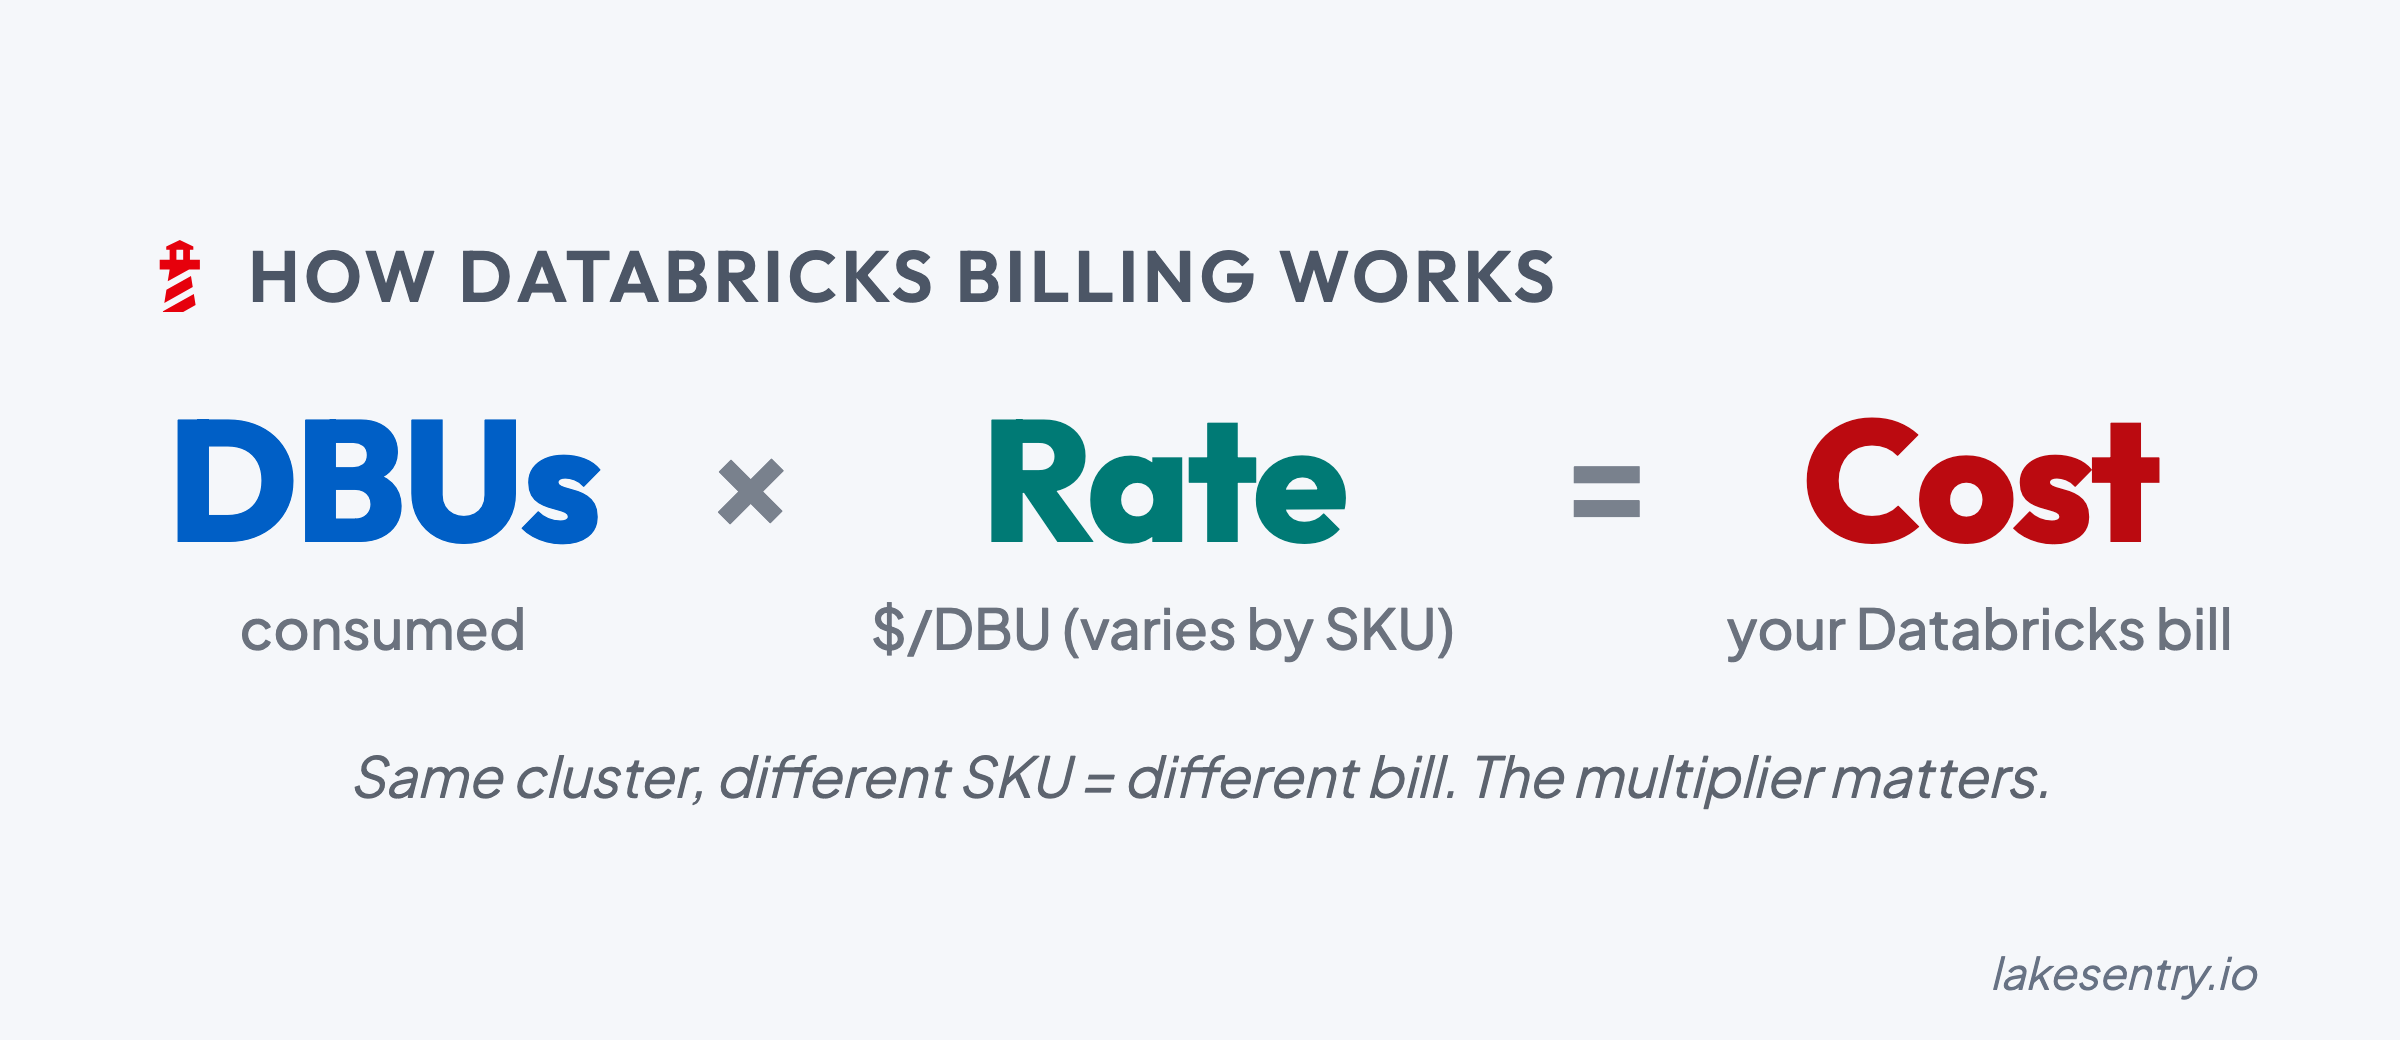
At a high level, the DBU portion of your Databricks bill is calculated as:
DBU Rate x DBUs Consumed = DBU Cost
That’s only part of the total, though: the underlying cloud infrastructure (VMs, storage, networking) is billed separately by your cloud provider and sits on top of the DBU cost.
To estimate spend or audit a usage spike, you typically need:
- Consumption: total DBUs used over a specific period (day/week/month).
- SKU rate: the specific price per DBU for your workload. Rates vary significantly between Jobs, SQL, and All-Purpose compute.
- Attribution: a breakdown by cluster, job, or team to identify which resources are driving the spend.
Common Workload Types
DBUs show up across many categories of Databricks usage, but consumption patterns can look different depending on what you’re running.
At a high level:
- Jobs / batch workloads: DBUs are driven by how long jobs run and how much parallelism you use at peak.
- SQL / warehouses: DBUs are driven by query volume, concurrency, and “always-on vs on-demand” patterns.
- ML / experimentation: DBUs can be spiky and developer-driven (ad-hoc work, iterative training runs, environment churn).
- All-purpose / interactive clusters: DBUs are often sensitive to “left running” time and concurrency.
Exact category mappings and rate differences depend on your Databricks plan and configuration.
What Drives DBU Consumption
Most “why did our DBU spend change?” investigations come back to the same handful of levers. Knowing the categories ahead of time makes the diagnosis faster when something moves.
Runtime and concurrency
The most common driver, and usually the first place to look. Workloads run longer than they used to, more workloads run at the same time, or a backfill extends past the window it was scoped to. None of these change the shape of what the platform is doing — they change how much of it is happening, and when.
Cluster sizing and resource selection
Spend can move even when runtime is steady. A driver gets bumped up for a one-off and stays bumped. Autoscaling bounds get widened during an incident and never get tightened again. A workload migrates from jobs compute to all-purpose compute because it was easier to develop that way, and the rate difference quietly compounds across every run.
Workload efficiency
This is the invisible multiplier. A retry loop kicked off by an upstream schema change. Data skew that turns a fast stage into a long tail. A query pattern that scans far more data than it needs to because a filter stopped pruning correctly. Small code changes that double the shuffle or I/O cost without anyone realizing. The total work goes up; the business output doesn’t.
”Always-on” vs “on-demand”
Often the answer isn’t “more work” but “the same work, on resources that never turn off.” Warehouses running past their peak window, clusters idling between jobs, dev and test resources that drift into production-like uptime because nobody’s watching them. The DBU rate while idle is the same as the DBU rate while busy.
Environment hygiene
The slow creep. Orphaned clusters from projects that wrapped months ago. Warehouses spun up for a launch and never decommissioned. Whole environments left running long after the work moved on — from one-off POCs, dev environments, etc. Nobody meant to do any of this, which is exactly why it accumulates: there’s no single moment where someone decides to keep paying for it.
A Practical Workflow for When Spend Changes
If you want “DBU calculator” accuracy, you eventually need the right rates. But to manage spend, you need explainability first.
Here’s a simple troubleshooting workflow that works in most environments:
-
Baseline your top DBU consumers by workload
- Identify the top drivers (jobs, warehouses, clusters, teams/projects, environments)
- Start with “top 10,” not “everything”
-
Track deltas (daily/weekly) to catch what changed
- Don’t stare at totals; track “what moved since last period?”
- Look for the first day the curve changed direction
-
Assign ownership for the top drivers
- “Shared” is a cost category, but it can’t be an ownership model
- Make sure every major driver has someone who can confirm expected vs unexpected
- (For how LakeSentry models this with attribution rules and chargeback, see the cost allocation docs.)
-
Test safe optimizations and verify impact
- Treat changes like production changes: small steps, measure, rollback path
- Confirm the DBU impact and the performance/reliability impact
This is where many teams discover the difference between native Databricks cost tools (visibility, exports, tables) and what a cost transparency layer adds (driver breakdown, attribution, and workflow). For a diagnostic checklist of the most common spend drivers, see 7 reasons Databricks spend changes.
FAQ
1. What does DBU stand for?
DBU stands for Databricks Unit, the normalized unit Databricks meters to bill compute, charged per second of use. It measures processing capability consumed, not a fixed amount of CPU or memory.
2. What is a DBU in Databricks?
A DBU is the metering unit behind most Databricks pricing. The DBUs a workload consumes depend on its compute type, instance size, and runtime, and the dollar rate per DBU depends on the compute type, tier, cloud, and region.
3. How do you convert DBUs to dollars?
Multiply DBUs consumed by the per-DBU rate for that workload’s SKU, then add the cloud infrastructure billed separately for classic compute. There’s no single DBU-to-dollar rate; it varies by compute type, tier, cloud, and region. See Databricks pricing explained for the rate card.
4. Do all compute types use DBUs at the same rate?
No. Jobs compute, all-purpose compute, SQL warehouses, and serverless each meter DBUs at different rates. The same workload can cost several times more on all-purpose than on jobs compute.
Using a Cost Transparency Layer
You can get a long way with built-in Databricks cost monitoring tools such as native exports, system tables, and dashboards — especially for baseline visibility. Where most teams stall is the operational layer above that: attribution that holds up across reorgs and renamed pipelines, explainability when a number moves, and a workflow the team runs when it does.
That’s the layer LakeSentry is built for. It produces a continuously updated breakdown of DBU cost drivers by workspace, job, and cluster, with ownership derived from your existing tags and team mappings, so the conversation can move from “we see the DBUs” to “we know what changed and who should look at it.”
See what's actually happening across your Databricks environment
Free tier — unlimited workspaces, no credit card. Connect in minutes.
Related reading
All-purpose compute costs roughly 2–3x more per DBU than jobs compute for the same workload. Here's when each fits, and how to see which one your jobs are running on.
How Databricks pricing works: what a DBU is, list rates by compute type, plan tiers, cloud and region differences, and the costs the calculator misses.
Databricks cost optimization is matching compute and warehouses to actual workload demand. Five steps: see cost, right-size, tune, automate, monitor.
Evaluating Databricks cost tools? Compare them side by side →