7 Reasons Databricks Spend Changes (and How to Diagnose Each One)
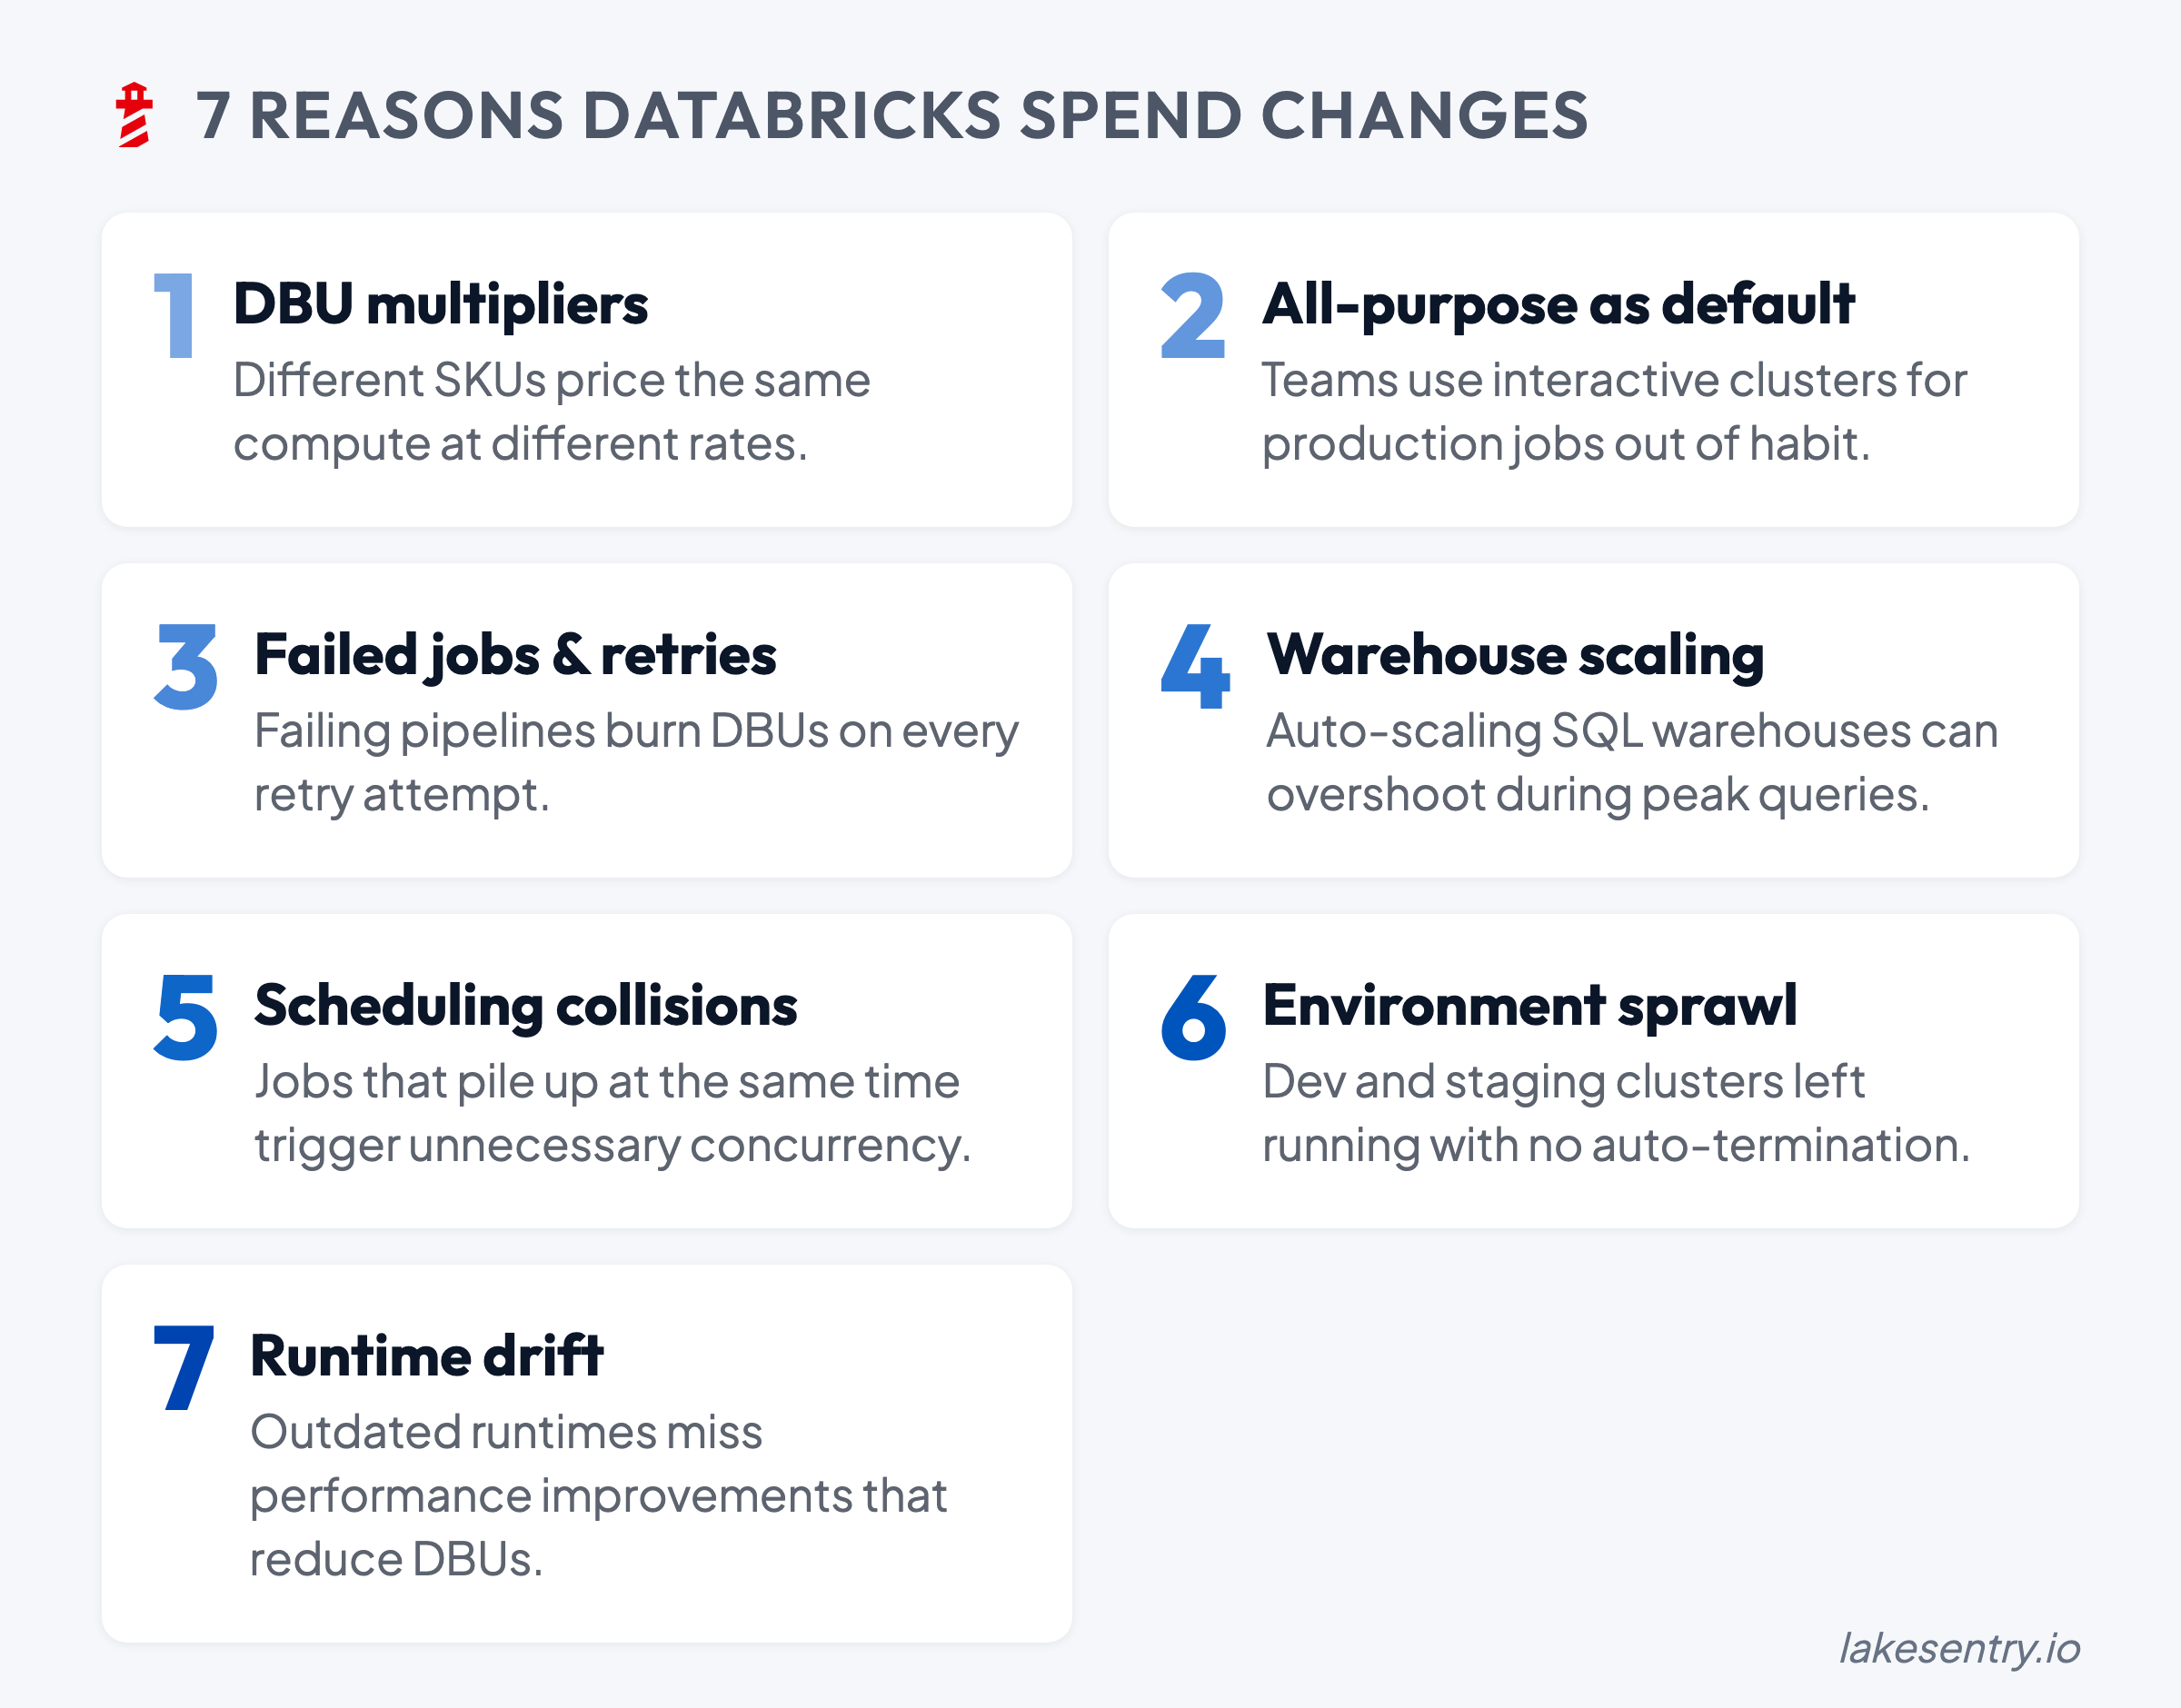
When Databricks spend moves, start here. Seven common drivers from DBU multipliers to retry storms, with diagnostic steps and safe first moves for each.
When Databricks spend moves, the main question is what actually changed: which workload, which config, which schedule. In this post, we have summarized seven common spend change drivers we see again and again, how to confirm each one, and a safe first step you can take without turning Databricks cost optimization into a firefight.
Before You Start: Separate DBUs from Cloud Costs
Your Databricks bill is really two layers stacked on top of each other. The DBU Databricks cost is what Databricks meters for its own usage. The cloud-infra layer is what your cloud provider charges separately for the underlying VMs, storage, and network (except in the serverless case, where Databricks runs the infrastructure in their account and bundles it into a higher DBU rate).
Most of the time the two layers move together, because the VMs running the workloads are also the thing producing the DBUs. But the ratio between them can shift in ways that change which lever actually matters:
- A storage-heavy workload pushes the cloud bill up faster than DBUs.
- A migration from classic compute to serverless can show up as “higher DBUs, lower cloud-infra bill” even when the total cost barely moved.
- An I/O-heavy or egress-heavy job can lift the cloud line without touching DBUs much at all.
The practical implication is that “spend went up” isn’t actually one question. Before diagnosing further, it’s worth asking: did the DBU line move, did the cloud-infra line move, or both? The drivers below are mostly DBU-side, but several of them show up on both layers, and the fix depends on which one is actually moving.
Once you know the layer, you can attach cost allocation to it: who owns the spend, by team, project, or environment. That’s what makes the next step safe.
1. DBU Multipliers: Same Work, Different DBU Burn
The first thing to rule out is whether the workload itself changed at all, or whether it just moved onto compute that meters differently. DBUs aren’t a direct proxy for CPU hours — the same pipeline can consume DBUs at very different rates depending on which compute SKU it’s running on. As a rough rule of thumb:
- All-purpose compute runs at roughly 2-3x the rate of jobs compute for the same instance type.
- SQL warehouses are priced on their own SKU.
- Serverless options sit on another rate again, with infrastructure bundled in.
Exact multipliers depend on plan, region, and cloud provider (see Databricks pricing explained for the full rate card).
The symptom is usually a step change rather than a gradual ramp: spend rises in one workload category around a specific date, even though volume looks about the same. That timing is the clue. Compare DBU consumption for the same logical workload before and after the suspected change, and check whether it migrated between SKUs. Migrations between any two of these can produce a sharp shift in consumption with no change in the underlying work.
The safest first move is to standardize compute patterns for that workload class, rather than re-tuning the workload itself. If a category change is genuinely needed, capture before-and-after consumption and runtime so the tradeoff is defensible later.
2. All-Purpose Clusters Becoming the Default
All-purpose compute is built for interactive work and it’s priced accordingly. The problem starts when it becomes the default layer for production-like workloads, or when shared all-purpose clusters get treated as long-lived infrastructure because nobody owns them enough to take them down.
The symptom looks like background spend: DBUs accumulating outside scheduled job windows, attached to clusters that have long uptime and inconsistent activity. The diagnostic question is whether production jobs or shared pipelines are running there because someone found it convenient, and whether anyone can name an owner. If the best answer to “who owns this cluster?” is “it’s shared,” that ambiguity is already part of the problem.
Hence, the first step should be to add structure around the usage of all-purpose clusters:
- Separate interactive development from scheduled production with different cluster policies.
- Apply timeouts and auto-termination as guardrails rather than hard blocks.
- Require every long-lived interactive cluster to have an owner and a stated purpose.
If an all-purpose cluster has neither owner nor purpose, then it becomes just additional spend rather than free convenience.
If the best answer to “who owns this cluster?” is “it’s shared,” that ambiguity is already part of the problem.
3. Failed Jobs and Retry Storms
Retries are one of the highest-leverage drivers on this list, because their cost compounds in ways that don’t show up cleanly on a spend chart. A job that fails three times before succeeding doesn’t just cost three times the original cost — it re-pays cluster startup each time, often runs longer than the original because it’s hitting the same upstream problem from a worse position, and pushes its runtime past its window, which oversubscribes pools and lifts the platform’s peak DBU rate. The result is a lump on the spend chart that looks like “more usage” when it’s really “the same work, run twice, on a hotter fleet.”
The diagnostic question is whether the top movers correspond to jobs with elevated failure rates or long retry chains, and whether those failures correlate with something upstream:
- A recent schema change that broke a downstream cast.
- A flaky dependency or external API timing out.
- A data quality issue surfacing as a null pointer deep in a transformation.
- A memory limit that’s been on the edge for weeks and finally tipped over.
Pipelines that are “green eventually” but expensive along the way are the ones to look at first.
Pipelines that are “green eventually” but expensive along the way are the ones to look at first.
4. SQL Warehouses Scaling Up — or Never Scaling Down
SQL spend is often the hardest to read because warehouse sizing, autoscaling, and uptime all move together with traffic. A small change in usage pattern can produce a large change in DBU burn if the warehouse is scaling up frequently or staying on through long idle periods.
The symptom is SQL spend drifting in a way that doesn’t quite match query volume. The clue usually shows up by comparing scaling events, peak concurrency windows, and idle vs active time. If a warehouse is effectively always-on — that’s worth checking before assuming users are just running more queries.
The core approach to mitigation is tuning for on-demand by design: sensible auto-stop windows, scaling boundaries that match actual concurrency.
5. Scheduling Collisions
Most environments don’t have a concurrency strategy — schedules evolved organically, jobs got copied with their cron strings intact, and two unrelated heavy workloads ended up starting at the top of the same hour because someone borrowed a config three years ago. Overlaps push the platform into higher peak capacity (more clusters, more autoscaling, more warehouse expansion), which lifts DBUs even when the total amount of work hasn’t changed.
The fastest way to spot this is to map the top DBU consumers to a timeline. Pile-ups are usually obvious once you see them:
- Multiple big jobs sharing a start minute.
- Backfills running into BI peak windows.
- CI-triggered jobs colliding with scheduled batch runs.
- Streaming jobs each sized for their own worst case running concurrently.
The first move is small: shift one non-critical heavy workload off-peak and watch the runtime and downstream impact for a week before deciding on the next one. The mistake to avoid is staggering jobs without understanding the dependency graph.
The mistake to avoid is staggering jobs without understanding the dependency graph.
6. Environment Sprawl
The slowest, most reliable driver on this list is dev/test environments quietly accumulating long-lived resources, generous defaults, and CI workloads that nobody monitors in aggregate. There’s rarely a single “big change”, but rather a slow additional cost growth every month.
Two patterns show up especially often. The first is development modes that keep clusters up for long working windows, which is great for productivity and expensive when nobody’s watching. The second is CI-driven workloads triggered on every commit, which are great for velocity until someone notices the aggregate.
To diagnose, break spend down by environment — using whatever your org uses for separation, whether that’s tags, workspaces, or service principals. A lot of teams already use separate workspaces or service principals per environment, which gives you a natural cost-allocation boundary even before tagging is fully consistent. Look at the largest non-prod movers, and check ownership on each — resources with unclear ownership are usually the ones that never get cleaned up, because there’s no single moment when someone decides to keep paying for them.
The fix is operational rather than technical:
- Lifecycle policies for non-prod (auto-stop defaults, cleanup for orphaned resources).
- Cost visibility broken down by owner, so “shared dev” doesn’t quietly become “nobody owns it.”
- Explicit use of workspace or service-principal boundaries for cost reporting and governance, if your org separates environments that way — it’s already doing half the work.
7. Photon and Runtime Version Drift
The last category is the one that’s easiest to miss, because it doesn’t look like a change at all — when the workloads, the schedules, and the cluster configs are all the same, but the actual execution engine underneath them changes.
Photon is the obvious example. It’s priced at a higher DBU rate than non-Photon compute, but it can execute supported operations significantly faster, which means total spend can go either way depending on the workload. Teams often flip Photon on globally because “faster is better,” and end up paying the higher rate on workloads that don’t really benefit:
- UDF-heavy code where Photon can’t accelerate the hot path.
- Small jobs where the speedup doesn’t outpace the rate multiplier.
- Queries dominated by operations Photon doesn’t support.
The reverse also happens: a workload that would benefit from Photon stays off it because nobody re-evaluated the default after it was set two years ago.
Runtime version drift is the quieter cousin of the same problem. Clusters pinned to older Databricks runtimes miss the optimizations and engine improvements that ship with newer LTS releases — better Adaptive Query Execution, improved Delta read paths, smarter shuffle behavior. The cluster keeps working exactly as it did, which is why nobody touches it, and the workload quietly runs slower (and burns more DBUs) than the same job would on a current runtime.
The diagnostic question is whether the engine settings still match the workload. For Photon, that means looking at whether it’s enabled on workloads that actually benefit, and disabled on the ones it just makes more expensive — Spark UI’s stage breakdown is usually enough to tell. For runtime versions, it means checking how old the pinned runtimes are across the platform, and whether the oldest ones are running the heaviest workloads.
The first step is small and reversible: pick one heavy workload, test it on the alternative configuration (Photon on/off, or current LTS runtime vs the pinned one), and compare runtime and DBU consumption. The answer is sometimes “the current setup is fine,” and that’s still a useful result, because it removes a suspect from the list.
The answer is sometimes “the current setup is fine,” and that’s still a useful result, because it removes a suspect from the list.
A Weekly Review Loop
For teams trying to reduce Databricks cost reliably, the fastest win usually is to establish a short weekly loop — which makes the difference between guessing and running controlled engineering changes:
- Baseline the top drivers by workload.
- Track week-over-week deltas, not just totals.
- Assign ownership for the top movers — including “expected, no action” as a valid outcome.
- Make one safe change at a time, with a rollback path.
For more on the underlying mechanics — how DBUs are metered, where they come from, and how the bill actually adds up — see our DBU explainer.
Native Tools vs a Transparency Layer
Native exports, system tables, and dashboards are the right starting point — they give you the raw material. The hard part is turning “we see the number” into “we know what changed, who owns it, and what we can safely do next” without rebuilding that work every quarter in a spreadsheet someone forgets to maintain.
That’s what LakeSentry is built for: a continuously updated breakdown of cost drivers by workspace, job, and cluster, with cost allocation derived from your existing tags and team mappings. So an investigation starts with a shortlist instead of a hunt. For how the platform flags meaningful changes early, see the anomaly detection docs. For more on what native tools can and can’t do here, see why native cost tools are not enough.
See what's driving your Databricks spend
Free tier — unlimited workspaces, no credit card. Connect in minutes.
Related reading
Databricks cost optimization is matching compute and warehouses to actual workload demand. Five steps: see cost, right-size, tune, automate, monitor.
How Databricks pricing works: what a DBU is, list rates by compute type, plan tiers, cloud and region differences, and the costs the calculator misses.
Photon roughly doubles DBUs per hour. Whether it lowers your bill depends on the workload. Pricing math, what to enable, and how to measure on yours.
Evaluating Databricks cost tools? Compare them side by side →