What Native Databricks Cost Tools Show — and What They Don't
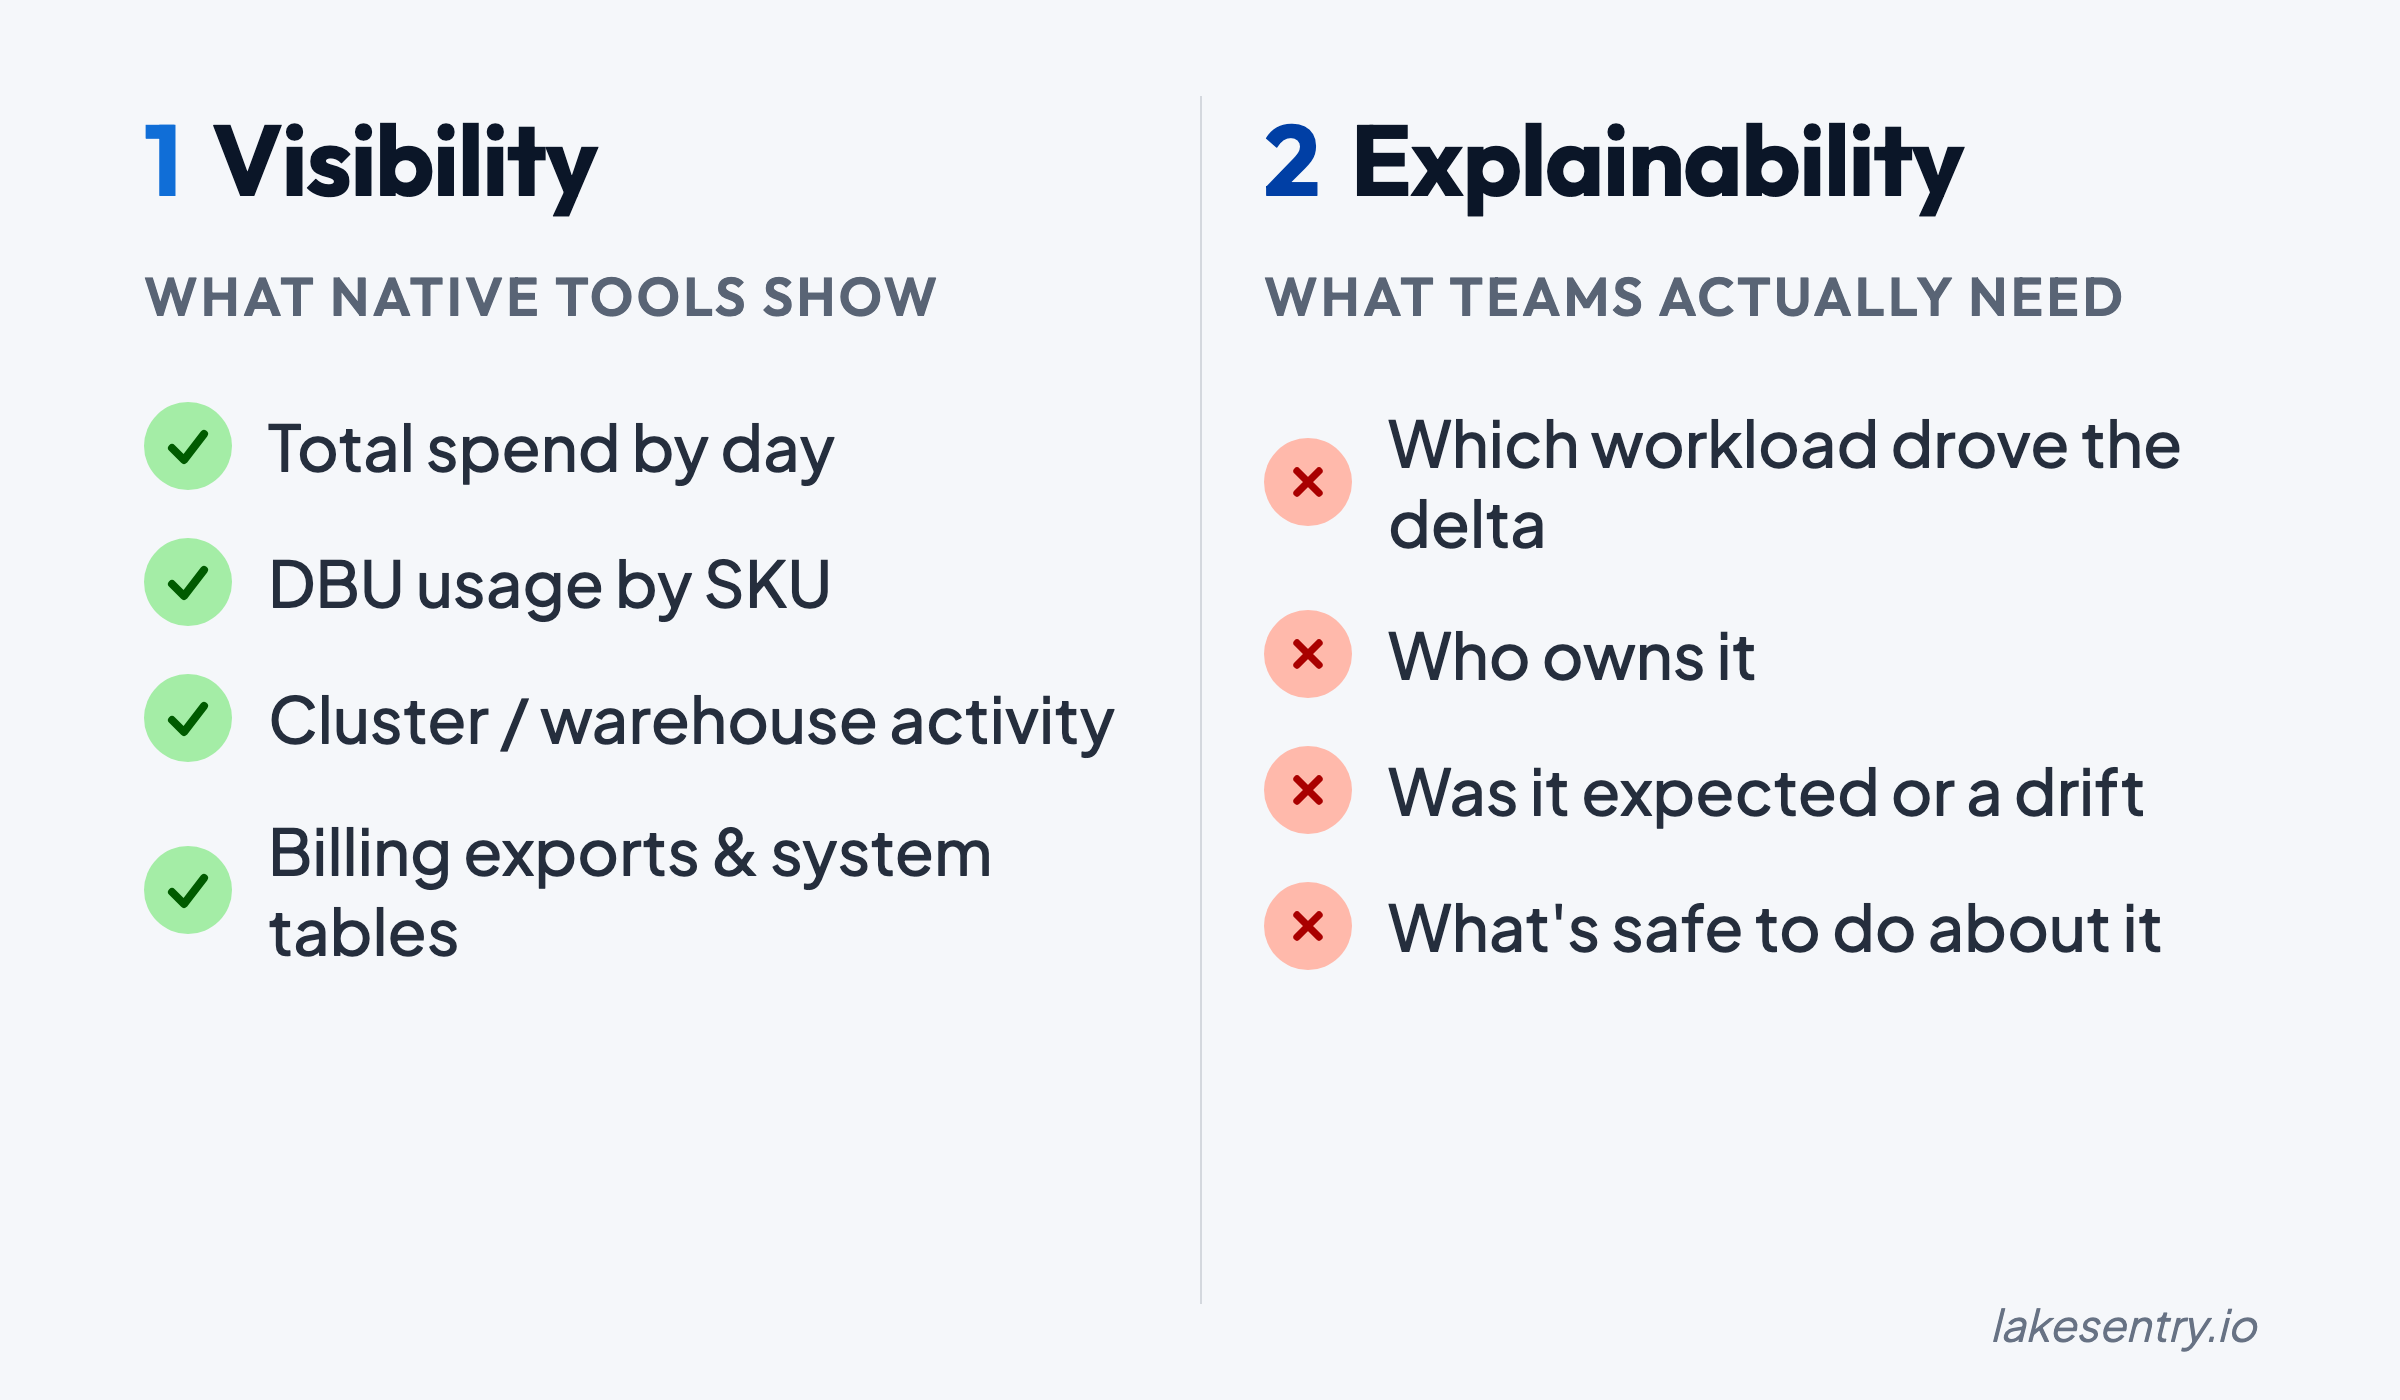
Native Databricks cost tools show totals from billing exports, system tables, and dashboards. They don't say what changed, who owns it, or what to do.
When Databricks spend changes, the question that matters is: what changed, and why?
Most teams already have “native” visibility: billing exports, system tables, usage dashboards, cluster/job metrics, maybe some tagging. That gets you the totals. But getting from “spend went up” to “this workload changed because of this reason, and this person can fix it” requires connecting cost signals to owners and drivers — not just charts.
What Teams Mean by “Native Databricks Cost Tools”
In practice, “native” refers to a mix of:
- Billing and usage exports (to cloud storage / your warehouse)
- System tables (
system.billing.usage,system.compute.clusters) and queryable usage data - Built-in UI dashboards or notebooks that summarize usage
- Cluster and job metrics (who ran what, when)
- Tagging / metadata (when it’s used consistently)
These are real signals. The gaps show up when you try to answer questions that have to be answered operationally, not academically.
What Native Tools Are Good For (and You Should Use Them)
Native tooling is a strong foundation for:
- Baseline visibility: total spend trends, big movers over time, top workspaces or clusters by usage
- Early anomaly detection (coarse): “something changed yesterday” at the account/workspace level
- Source-of-truth raw signals: exports and system tables you can model and enrich
- Shared language: a common place to start the conversation when FinOps and platform teams review spend
Native tools answer “what’s the total?” well. The question they struggle with is “what changed and who owns it?”
The Real Blocker: Databricks Cost Model Complexity
Databricks costs rarely map cleanly to a single dimension.
Even with a clean export, spend can be driven by a combination of:
- Workloads that change shape (batch vs streaming, backfills, retries)
- Shared compute patterns (shared clusters, shared jobs, shared orchestration)
- Environment differences (dev/stage/prod) that blur together when ownership isn’t enforced consistently
- Product and platform features that create indirect cost
That’s why aggregate charts often produce the same frustrating outcome:
You can see that spend changed. You can’t say why it changed.
The complexity is real, and native tools surface it faithfully. What they don’t do is resolve it — connect the cost line to a workload, an owner, and an explanation. For a diagnostic checklist of the most common drivers, see 7 reasons Databricks spend changes.
Visibility vs Explainability: “What Changed?” Is the Question That Matters
A dashboard that shows “compute went up 18%” tells you something happened. It doesn’t tell you what to do about it.
Explainability means you can reliably answer:
- Which workload drove the increase?
- Which team, project, or environment owns it?
- Was the driver more data, more runtime, a config change, or retries?
- Is this a one-off event or a trend that will repeat tomorrow?
Native signals help, but they don’t automatically produce a driver narrative. That requires attribution logic (mapping cost to owners) and workflow discipline (acting on what you find).
Ownership and Attribution Break Down in the Real World
Attribution fails for boring reasons:
- Tags exist, but they’re missing or inconsistent
- Naming conventions drift over time
- Resources are shared across teams, and “shared” becomes synonymous with “nobody owns it”
- The mapping from technical identifiers (job/cluster/workspace) to business ownership (team/project/env) isn’t maintained
When this happens, you end up with visibility without accountability. You can point to the cost, but not to an owner who can validate whether it’s expected — and fix it if it’s not.
Cost transparency requires an enforced ownership model. For how LakeSentry models attribution and confidence tiers, see the cost attribution docs.
Operationalization Is the Hard Part (Not Charts)
Even when teams can compute attribution, the bigger challenge is making it repeatable:
- Who reviews deltas, and how often?
- What threshold triggers investigation?
- Where do explanations get captured so you’re not re-learning the same lesson next month?
- How do you turn “this job got expensive” into a remediation task that ships?
Without a workflow, cost work becomes a series of urgent deep-dives that never create a lasting system. The loop that works is short: signal → owner → explanation → action. For a deeper look at how DBU costs drive these signals, see the DBU explainer.
What “Cost Transparency” Looks Like in Practice (a Checklist)
If you’re evaluating whether your current setup is “enough,” here’s a practical definition.
You have cost transparency when you can deliver:
- Consistent ownership (team/project/env) across your Databricks spend
- Reliable attribution logic that survives new workloads, new clusters, and platform evolution
- Explainability: deltas come with drivers, not just totals
- Visibility where it matters: investigations shouldn’t take days
- Workflow integration: an operational loop for review, assignment, and remediation
- Auditability: you can show how a number was computed and why it changed
Native tooling contributes to several of these, but closing the full loop usually requires dedicated investment — either internal tooling or a platform built for it.
How to Build Toward Cost Transparency (Pragmatic Steps)
If you’re starting from “we have exports and dashboards,” these steps are a practical path forward:
-
Define ownership first (before you build dashboards)
- Decide what “owner” means (team, cost center, platform domain, product line)
- Define how it’s represented (tags, policies, mapping tables)
- Make it enforceable, not aspirational
-
Standardize attribution inputs
- Enforce tagging rules where you can
- Create a mapping layer for the places you can’t (shared services, platform overhead)
- Treat attribution like a product: version it, test it, review changes
-
Shift from totals to delta reviews
- Build a weekly (or daily, for fast-moving environments) delta workflow
- Focus on “what changed since last period” instead of “what is the total”
-
Make investigations faster than the next surprise
- Capture common drivers and remediation patterns
- Track “known expected changes” (new pipeline launch, backfill window, seasonal load)
-
Integrate cost monitoring into the way teams already work
- Route cost deltas to the right owners
- Create a place to document explanations and follow-ups
- Close the loop so you don’t re-triage the same pattern repeatedly
Where LakeSentry Fits
LakeSentry sits on top of native Databricks signals — system.billing.usage, billing exports, cluster metadata — and adds the layer most teams can’t maintain by hand: attribution that holds up when teams reorg, explainability when a number moves, and a workflow that turns cost signals into owned action items.
For a side-by-side of native tooling and a third-party option, see native Databricks cost tools vs LakeSentry or the full Databricks cost tools comparison.
See what your Databricks environment is actually doing
Free tier — unlimited workspaces, no credit card. Connect in minutes.
Related reading
FinOps for Databricks stalls when teams optimize before they can explain spend. Build transparency first: attribution, explainability, shared definitions.
Databricks cost optimization is matching compute and warehouses to actual workload demand. Five steps: see cost, right-size, tune, automate, monitor.
What Databricks system tables tell you, what they don't, and how to build a cost monitoring layer that catches anomalies before someone opens a ticket.
Evaluating Databricks cost tools? Compare them side by side →